Bonjour,
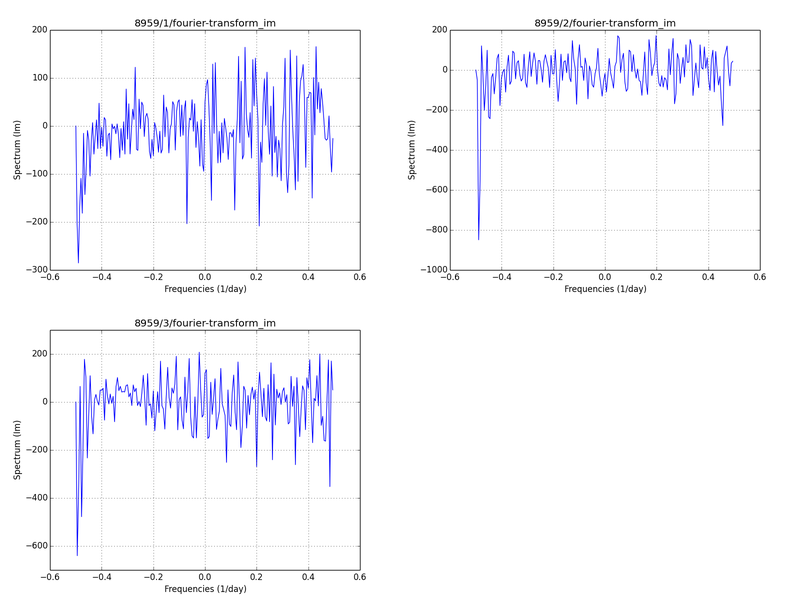
Je souhaiterais, avec Python et matplolib, faire quelque chose comme ça :

Pour l'instant, j'utilise la méthode subplot et la fonction suivante :
1 2 3 4 5 6 7 8 9 10 11 12 13 14 15 16 17 18 19 20 21 22 23 24 25 26 27 28 29 | def gallery(x_list, y_list, titles): l = len(x_list) if titles == []: titles = ["" for i in range(l)] n = int(ceil(sqrt(l))) if n <= 1: draw(x_list[0], y_list[0], titles[0], "x", "y") return f, axarr = plt.subplots(n, n) for k in range(l): i = k // n j = k % n x = x_list[k] y = y_list[k] title = titles[k] axarr[i, j].plot(x, y) axarr[i, j].set_title(title) def show_gallery(x, y, titles=[]): gallery(x, y, titles=[]) plt.show() plt.clf() |
Seulement, il y a deux soucis :
- Pour n = 2, je me retrouve avec un graphe 2x2
Mais f, axarr = plt.subplots(1 if n == 2 else n, n) me renvoie IndexError: too many indices pour la ligne axarr[i, j].plot(x, y).
- Pour n n'étant pas un carré, j'ai des graphes vides dans le coin inférieur droit
Puis-je les effacer ?
Merci !
+0
-0


